.png)
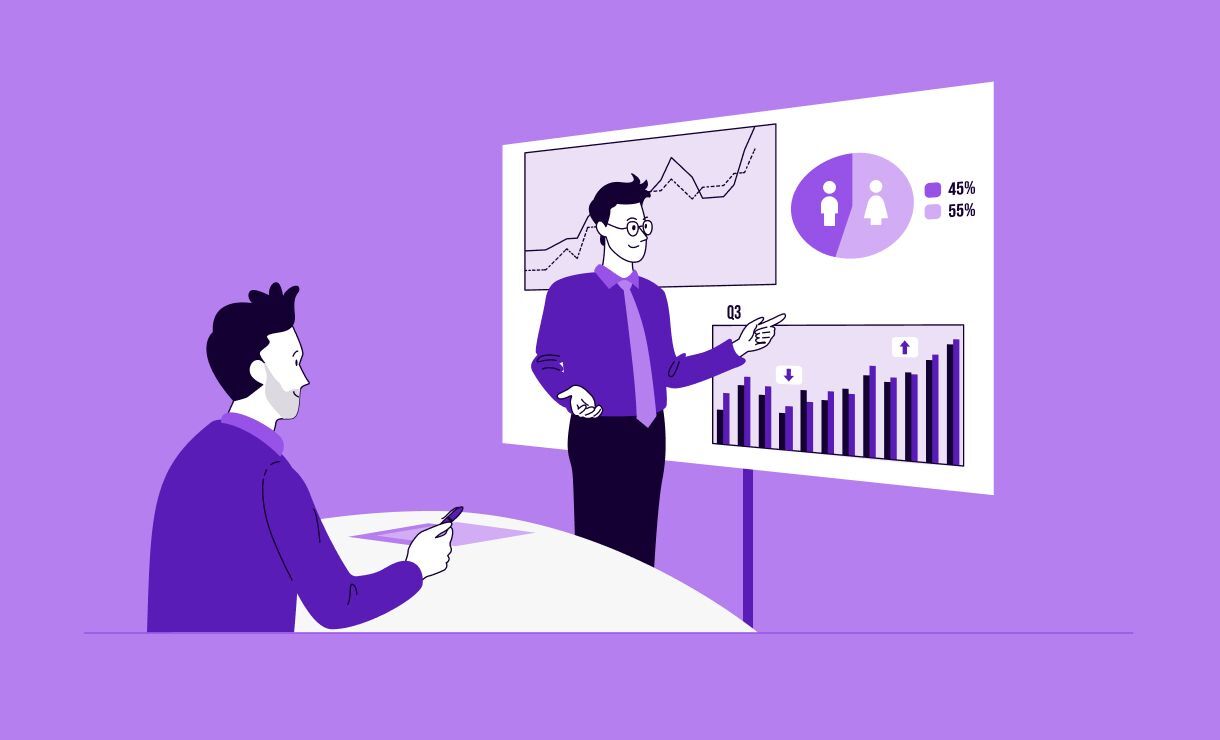
Your leadership team wants to know why customer support keeps losing people. You pull the turnover rate for the last two quarters, and it confirms the problem. It doesn't tell you the cause.
People analytics closes that gap. Line up customer support's turnover rate against its engagement score, survey comments, and sick leave pattern for the same period, and the cause starts to show, whether it's understaffing, a strategy mismatch, or a manager issue you can name and act on.
Most HR teams already have the data. The usual approach is to report each number on its own, a turnover rate here and an engagement score there. Tools that work well individually create blind spots when they're disconnected, and nobody looks at the joins between them.
Key takeaways
-
People analytics uses people data to explain workforce problems and support team decisions.
-
Reading performance, engagement, absence, and feedback together for one team finds causes that any single metric hides.
-
Hiring data, such as retention by hiring source, links later performance and turnover back to recruiting.
-
Reliable analysis depends on accurate, connected records and performance ratings that mean the same thing across teams.
-
What you measure changes as your company grows from 20 to 100 employees and beyond.
-
Short, regular people reviews with leadership turn findings into staffing and strategy decisions.
What people analytics is and what it covers
People analytics, HR analytics, and workforce analytics describe the same practice: using people data to answer business questions. Some teams use "workforce analytics" for a wider scope that includes contractors and temporary staff.
The data comes from systems you already use.
-
Your human resources information system (HRIS), with headcount, contracts, tenure, and leavers
-
Recruiting data: time to hire, source of hire, and candidate pipeline
-
Absence and time records, including sick leave
-
Performance reviews and goal progress
-
Engagement survey scores and written comments
-
Exit interview feedback
People analytics covers the whole employee lifecycle, from the moment someone applies to the day they leave. Recruiting data belongs in the mix because a slow or inconsistent hiring process shows up later as weaker performance and faster turnover. You can't see that connection if hiring data sits in a separate system nobody checks.
Analysis happens at four levels, and each one answers a different question.
|
Level |
Question it answers |
HR example |
|---|---|---|
|
Descriptive |
What happened? |
Customer support turnover rose last quarter. |
|
Diagnostic |
Why did it happen? |
Exit feedback and survey comments both point to limited growth opportunities due to increased workload |
|
Predictive |
What's likely to happen? |
Teams with falling engagement and rising sick leave are more likely to lose people next. |
|
Prescriptive |
What should you do? |
Add headcount or narrow the team's scope before workload leads to burnout. |
Most growing companies work at the first two levels, and that's a sensible place to be. An HR generalist who exports headcount and leavers for the monthly leadership meeting is doing descriptive analytics. When a manager then asks why people are leaving the team, the question becomes diagnostic, and that's where most of the value sits.
One metric hides the cause; several signals find it
A turnover rate, an engagement score, or a spread of performance ratings can't tell you the cause on its own. When HR reports each number in isolation, it flags problems it can't act on, and leaders make staffing calls with half the picture.
One pattern comes up again and again in HR teams that look at these signals together: low performance, low engagement, repeated workload comments, and rising sick leave in the same team. That mix usually points to a staffing or strategy problem. Treating it as four individual performance issues misses the cause.
Nishma Kamdar, Global HR Business Partner at Tellent, describes how her team works through it.
In customer support, a falling CSAT score, a dip in the engagement survey, comments about being short-staffed, and a rise in sick days in the same quarter all point to one underlying problem, seen from four angles.
What's changing for HR teams in Europe
Two regulatory shifts are making this kind of connected view less optional.
The EU AI Act's high-risk rules are coming for HR tools. Under Annex III of the Act, AI systems used in employment and worker management are classed as high-risk. That covers tools that help with hiring, performance evaluation, or decisions about promotion and termination.
Following the EU's AI Act simplification (the "Digital Omnibus"), adopted in 2026, these obligations now apply from 2 December 2027 rather than the original 2026 date. If you use AI to score candidates, summarize reviews, or flag attrition risk, build in time to document how those tools work and keep a person reviewing their output.
The EU Pay Transparency Directive is the second shift. Member states had to write it into national law by 7 June 2026. None of Belgium, France, Germany, or the Netherlands met that date, according to a July 2026 review by L&E Global.
Once national laws take effect, reporting requirements depend on company size. Employers with 250 or more employees report gender pay gap data annually, with first reports due 7 June 2027 covering 2026 pay data under the Directive. Employers with 150 to 249 employees report on the same first deadline, but every three years, and employers with 100 to 149 employees join the cycle from 2031.
National laws can shift these dates. The Netherlands, for example, plans its first reports for 7 June 2028 for employers with 150 or more employees, under a bill meant to take effect on 1 January 2027 and now before parliament. In France, a bill presented to the Council of Ministers on 9 September 2026 would keep the reporting threshold at 50 employees instead of the Directive's 100, but parliament still has to approve it.
Pay transparency reporting depends on the same foundation as the rest of people analytics: job levels, pay bands, and performance ratings defined consistently and calibrated across managers.
A company that can already produce a clean, department-level view of performance and pay is most of the way to a compliant pay gap report. A company still running ratings through five different spreadsheets has two jobs to do at once.
Reading people signals together
Four habits help you read the signals together and turn disconnected data points into a comprehensive view of what's happening in your teams.
Combine performance, engagement, and absence data by department
Start with one team and line up its ratings, engagement score, survey comments, sick leave, and progress on department goals for the same period. Before you act on what you find, test the pattern in conversations with the manager and a few team members. Ask them whether it matches their experience before you take it to leadership.
Managers can have blind spots here. A manager may believe a team is doing well while anonymous survey feedback says otherwise. In a Gallup study of over 2,700 US managers and over 12,000 individual contributors, nearly 60% of managers said they do a good job recognizing their team's work, while only 35% of individual contributors agreed. Comparing managers' views with the team's survey results shows where the two differ.
Connect attrition to what people tell you
A turnover rate on its own tells you people left. Linking it to engagement themes, such as benefits, growth opportunities, and learning and development, tells you why. Nishma Kamdar compares attrition with engagement scores.
In practice, read exit feedback alongside earlier survey comments from the same team. If leavers mention growth and the survey flagged growth six months ago, you've found a pattern worth taking to leadership.
Check that performance data is fair before you trust the pattern
Performance ratings feed into every pattern above, so they need to mean the same thing across teams. If one manager rates generously and another strictly, comparing their teams will mislead you.
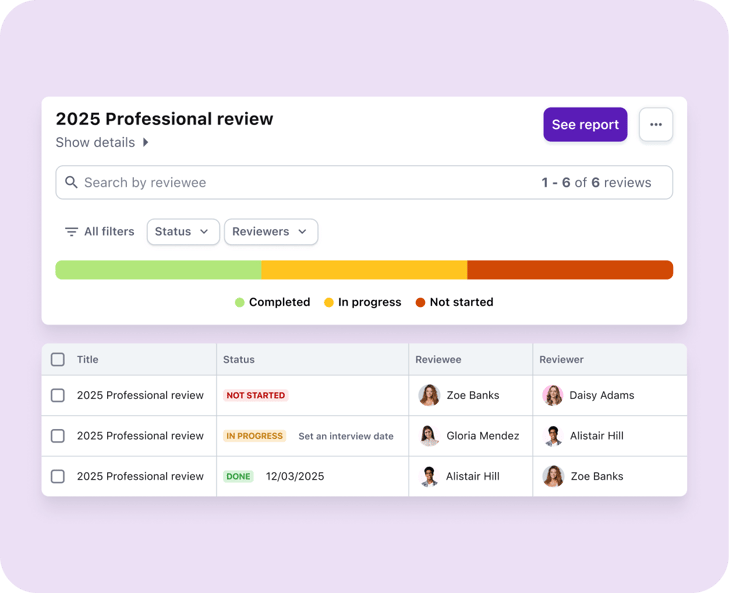
Tellent's People team runs structured performance reviews in four steps.
-
The employee completes a self-reflection before seeing the manager's input.
-
The manager prepares a separate assessment, supported by behavioral and performance examples.
-
The employee and manager discuss both views in a joint conversation.
-
HR and leadership calibrate ratings across teams, so one manager's "exceeds expectations" matches another's.
Manager training supports this. Rating-scale guidance, bias training, and templates that prevent recency bias all make the data more reliable. To check whether it's working, look at rating patterns and calibration outcomes across teams.
Read hiring signals alongside the rest of the lifecycle
People analytics starts before someone's first day. Quality of hire and retention by hiring source tell you whether your recruiting process sets teams up to succeed or creates the problems you'll diagnose six months later.
If one hiring channel consistently produces hires who leave within a year, or whose performance ratings trend lower than average, the problem starts in hiring. Tellent Recruitee's reporting covers source effectiveness and candidate quality alongside the rest of the hiring funnel, so recruiting data doesn't sit apart from the rest of your people data.
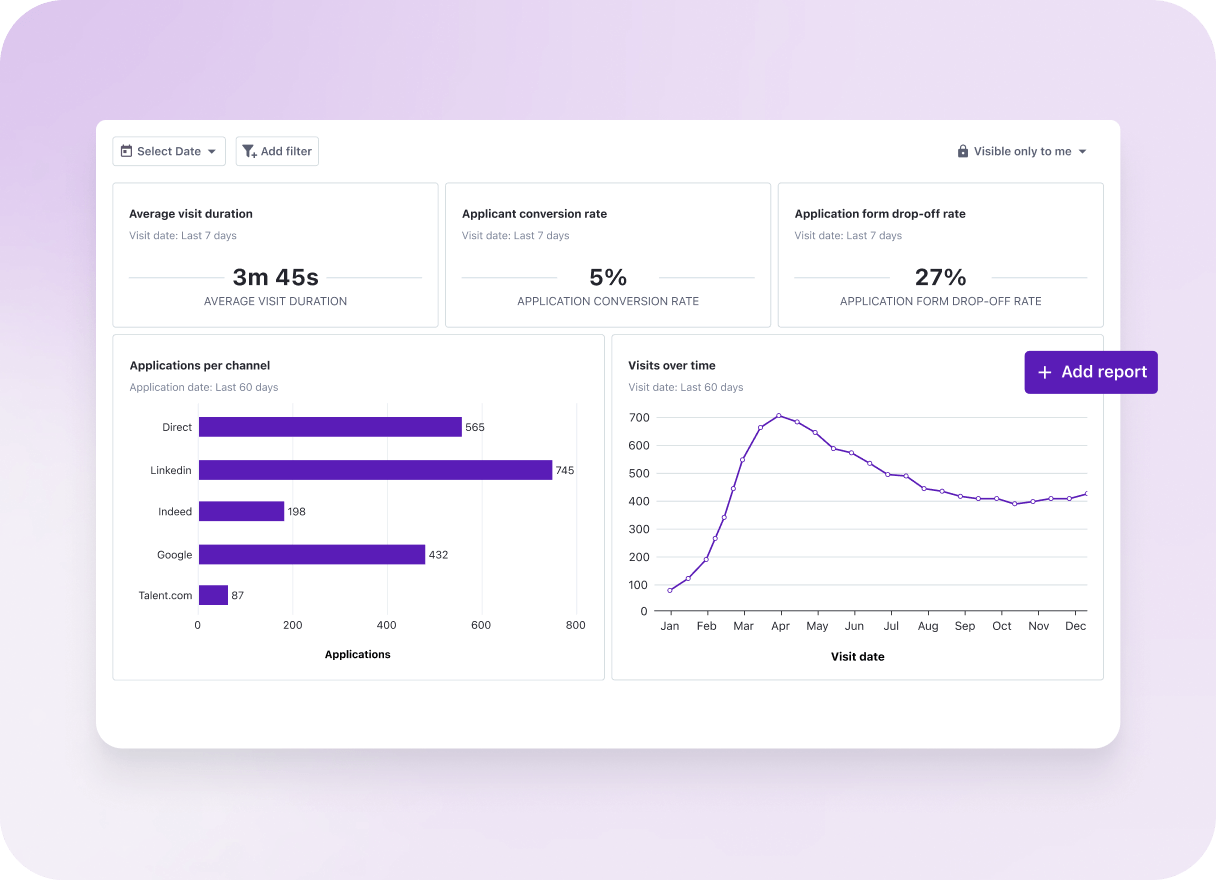
Connecting the two means you can trace a department's "staffing problem" back to where those hires came from.
What this means as your company grows
As you grow, the data foundation you need changes, and so do the questions worth asking.
Scattered data makes every report harder to trust
People analytics is only as reliable as the records behind it. When employee information is spread across drives, email, spreadsheets, and chat tools, every report means checking several sources.
Fragmented systems also push managers to keep their own shadow spreadsheets, adding compliance risk and leaving you with several versions of the same headcount.
Sick leave is health data and needs careful handling
Sick leave looks like an operational number, but under GDPR, health data sits in a special category with tighter rules than ordinary employee data. That changes how you should analyze it by department.
Reporting sick leave by team is useful, and it's one of the signals in the pattern described earlier. Do it in a way that doesn't expose any one person's health information.
-
Report absence trends at department level only when the group is large enough that no individual's pattern is identifiable. A common starting point is a minimum of five employees per reported group; confirm the right threshold with your legal or data protection advisor before you set a policy.
-
Keep sickness reasons and medical notes restricted to HR, separate from the headcount and date data a manager might see.
-
Document the legal basis for processing health data and your retention period, as GDPR requires for special category data.
If you're running an HR team in Germany or the Netherlands, add one more step. Works councils (Betriebsrat in Germany, ondernemingsraad in the Netherlands) typically have co-determination rights over how employee data, including sick leave and performance data, is collected and reported. Involve them before you roll out team-level reporting.
Manual reporting makes all of this harder to do well. Marieke Drees describes the trade-off.
That's the case for building sick leave reporting into a connected system from the start, instead of assembling it by hand every time someone asks.
Growth changes what you need to measure
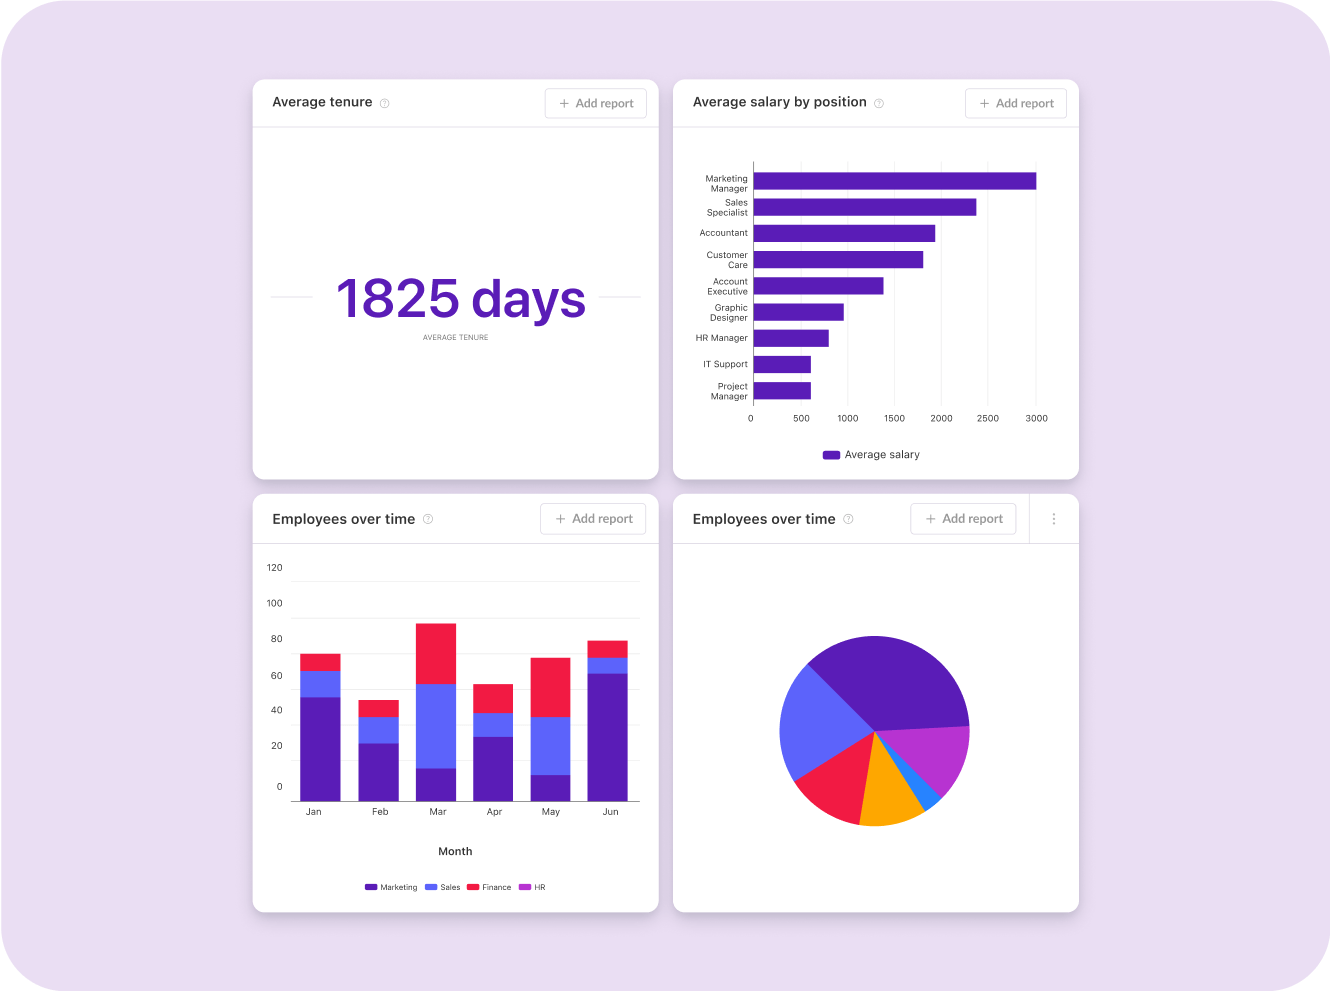
Marieke Drees sees people analytics needs change at fairly predictable stages. The ranges below are approximate.
|
Growth stage |
Main need |
Typical questions |
|---|---|---|
|
Up to about 20 employees |
One usable source of people data |
Who works here, on what contract, and since when? |
|
About 20-50 employees |
Automated HR admin, so a small team has time for analysis |
How much time goes into leave requests and onboarding paperwork? |
|
About 50-100 employees |
Manager self-service and stronger reporting |
Which teams have rising absence or open performance concerns? |
|
Over 100 employees |
Analysis that supports strategic decisions |
How are turnover, sick leave, diversity, equal pay, and manager effectiveness developing? |
If spreadsheets no longer keep up, the guide to outgrowing HR spreadsheets covers the signs and how to switch.
How to start using people analytics
These five steps work with the data most HR teams already have.
1. Start with one business question
Build your first people analytics review around one question that leadership cares about, such as "Why is turnover higher in customer support?" or "Does the sales team need another person?" Agree on the question with the department head, so the data you gather has a known use.
The mistake to avoid is building a dashboard of everything. You'll spend weeks on charts nobody asked for, and leadership's actual question stays unanswered.
2. Break results down by department and over time
Company-wide averages hide the teams that need help. Split survey scores, comments, absence, and ratings by department, and compare each period with the last.
How deep your people analytics goes depends on your stage. High-level summaries work for a small company. More mature HR teams need department breakdowns, raw comments, and segmented scores to plan targeted actions.
3. Review people data on a fixed schedule
Ad hoc reviews happen only after something has gone wrong. A fixed rhythm lets you spot patterns earlier. Tellent's People team runs a full people review for each department once a month, and takes the findings to leadership every quarter.
Nishma Kamdar warns against staying reactive.
Bring the same signals each time, including sick leave, employee relations cases, joiners and leavers, performance concerns, engagement results, and progress on department goals.
4. Bring leaders short, decision-ready insights
Nishma Kamdar advises HR teams to think from leadership's position.
Leave the raw data out of the slides. One page per team, with the pattern and a proposed action, such as a bandwidth gap, a retention risk, or a missed goal, is enough.
5. Use AI to summarize, and keep people in charge
AI summaries help you quickly spot themes and priorities when a small team has hundreds of comments to read. The people who know the context still make the decision. Read the raw comments behind any theme before you share it with leadership, because a summary can miss the detail that explains a problem.
How Tellent supports people analytics
Most HR tech is built around disconnected moments, with a hiring tool in one place, a core HR system in another, and a separate survey platform for engagement. That's how people decisions get made in isolation, based on whatever data happens to be in front of you, with no feedback loop between a decision and its outcome.
Tellent's modules connect those moments, so the signals in this guide live in one system.
-
Tellent Recruitee covers hiring: candidate pipeline, time to hire, and the source-effectiveness and candidate-quality reporting behind the hiring signals section above.
-
Tellent HR Manage is the system of record: one employee database, absence and time tracking, and standard HR reports on headcount, seniority, attendance and absence, and new hires, with one-click exports.
-
Tellent HR Grow runs performance reviews, 360° feedback, and engagement surveys, with dashboards you can filter by employee group.
-
Tellent Intelligence is the AI and automation layer. It summarizes open-ended feedback and surfaces recurring themes. The decision stays with you.
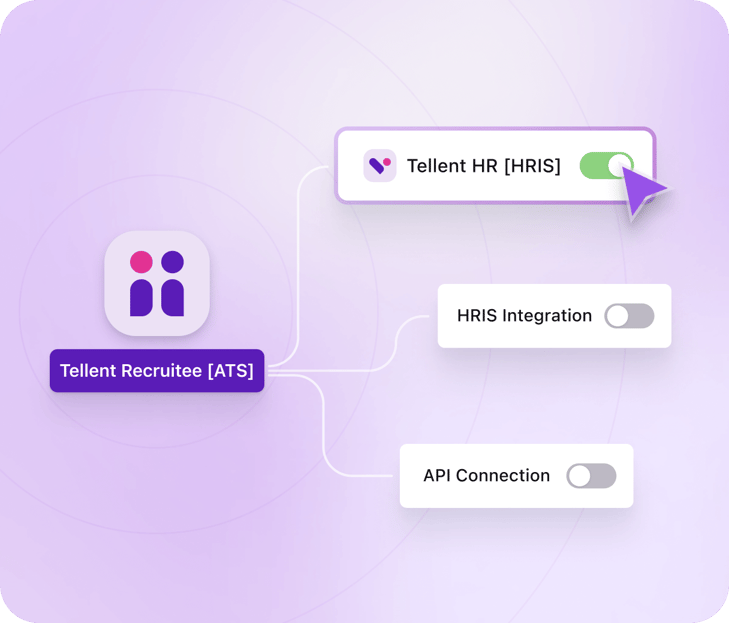
Because hiring, core HR, and performance data sit in one connected system, you can more easily trace a pattern in one module back to its source, whether that's a hiring channel, a workload issue, or a manager gap.
Tellent is also extending that connected view with agentic AI. Tellent Agent, announced in September 2026, adds an Analytics capability that answers plain-language questions about hiring data today, with an expansion to HR Manage data planned for its public beta phase. It's in a six-week closed beta first, and every action it takes needs user approval.
Better people decisions start here
Customer support's turnover rate showed that people were leaving. Put it next to the team's engagement score, its survey comments, and its sick leave pattern for the same quarter, and the cause becomes visible, whether it's understaffing, a strategy mismatch, or a manager issue. Connecting the data turns a report into a decision.
Your first step can be small. Pick one business question, and run a department people review this month with the data you already have.
Explore Tellent HR to see how connecting hiring, core HR, and performance data makes that review easier to run.